Data made simple  

Make sense of your data in seconds—no matter the size or complexity.

Data powered teams 

Empower your teams to collaborate and make the right decisions—at the right time, in the right place. 

Data armed to perform  

Handle massive data at lightning speed, with security built in at every step. 

Used and trusted by major security agencies
and organizations in the MENA region

No-code dashboard and chart builder

  • 50+ chart types to fit every analysis need

  • Fully customizable dashboards and charts

  • Drill down to the insights that matter

  • Smart filter builder for precise, tailored views

  • Generate full reports in just seconds

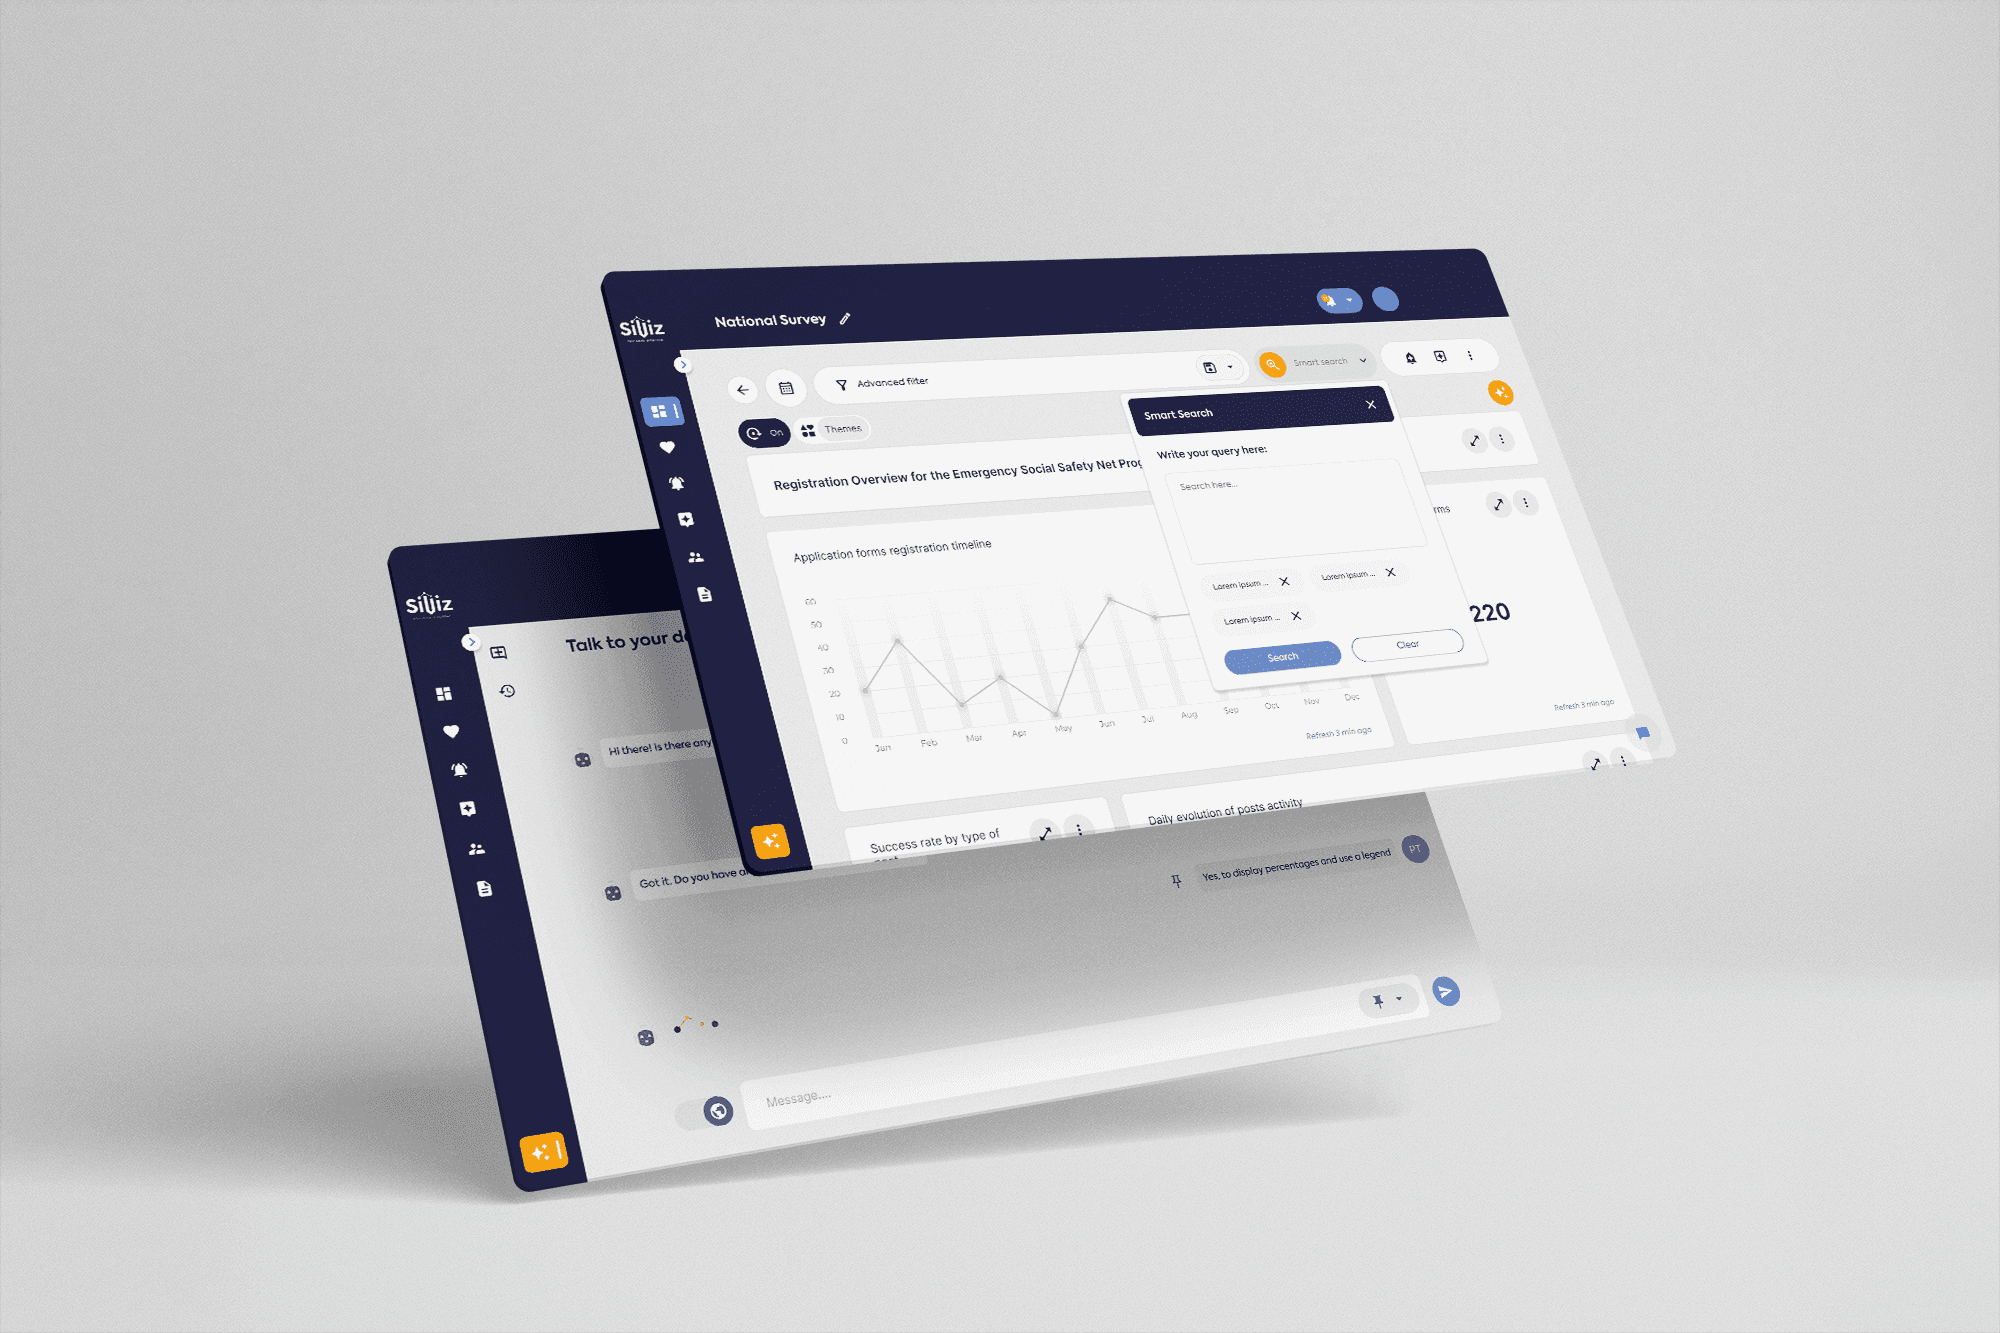
AI-Powered search & visualization

  • Smart search - cut through the noise; no exact words needed

  • Talk to your Data - ask our AI to analyse any data source, instantly

  • Generate visualisations on prompt

Security and governance

  • Secure personal identifying information with advanced protection

  • Granular access control to specific database sections

  • Customizable permissions for individuals or groups

  • On-premises deployment for complete security control

Collaboration tools

  • Real-time alerts and actionable recommendations

  • Instant team collaboration via chat

  • Easily share dashboards or specific charts

  • Embed visualizations seamlessly into your apps

Data integration

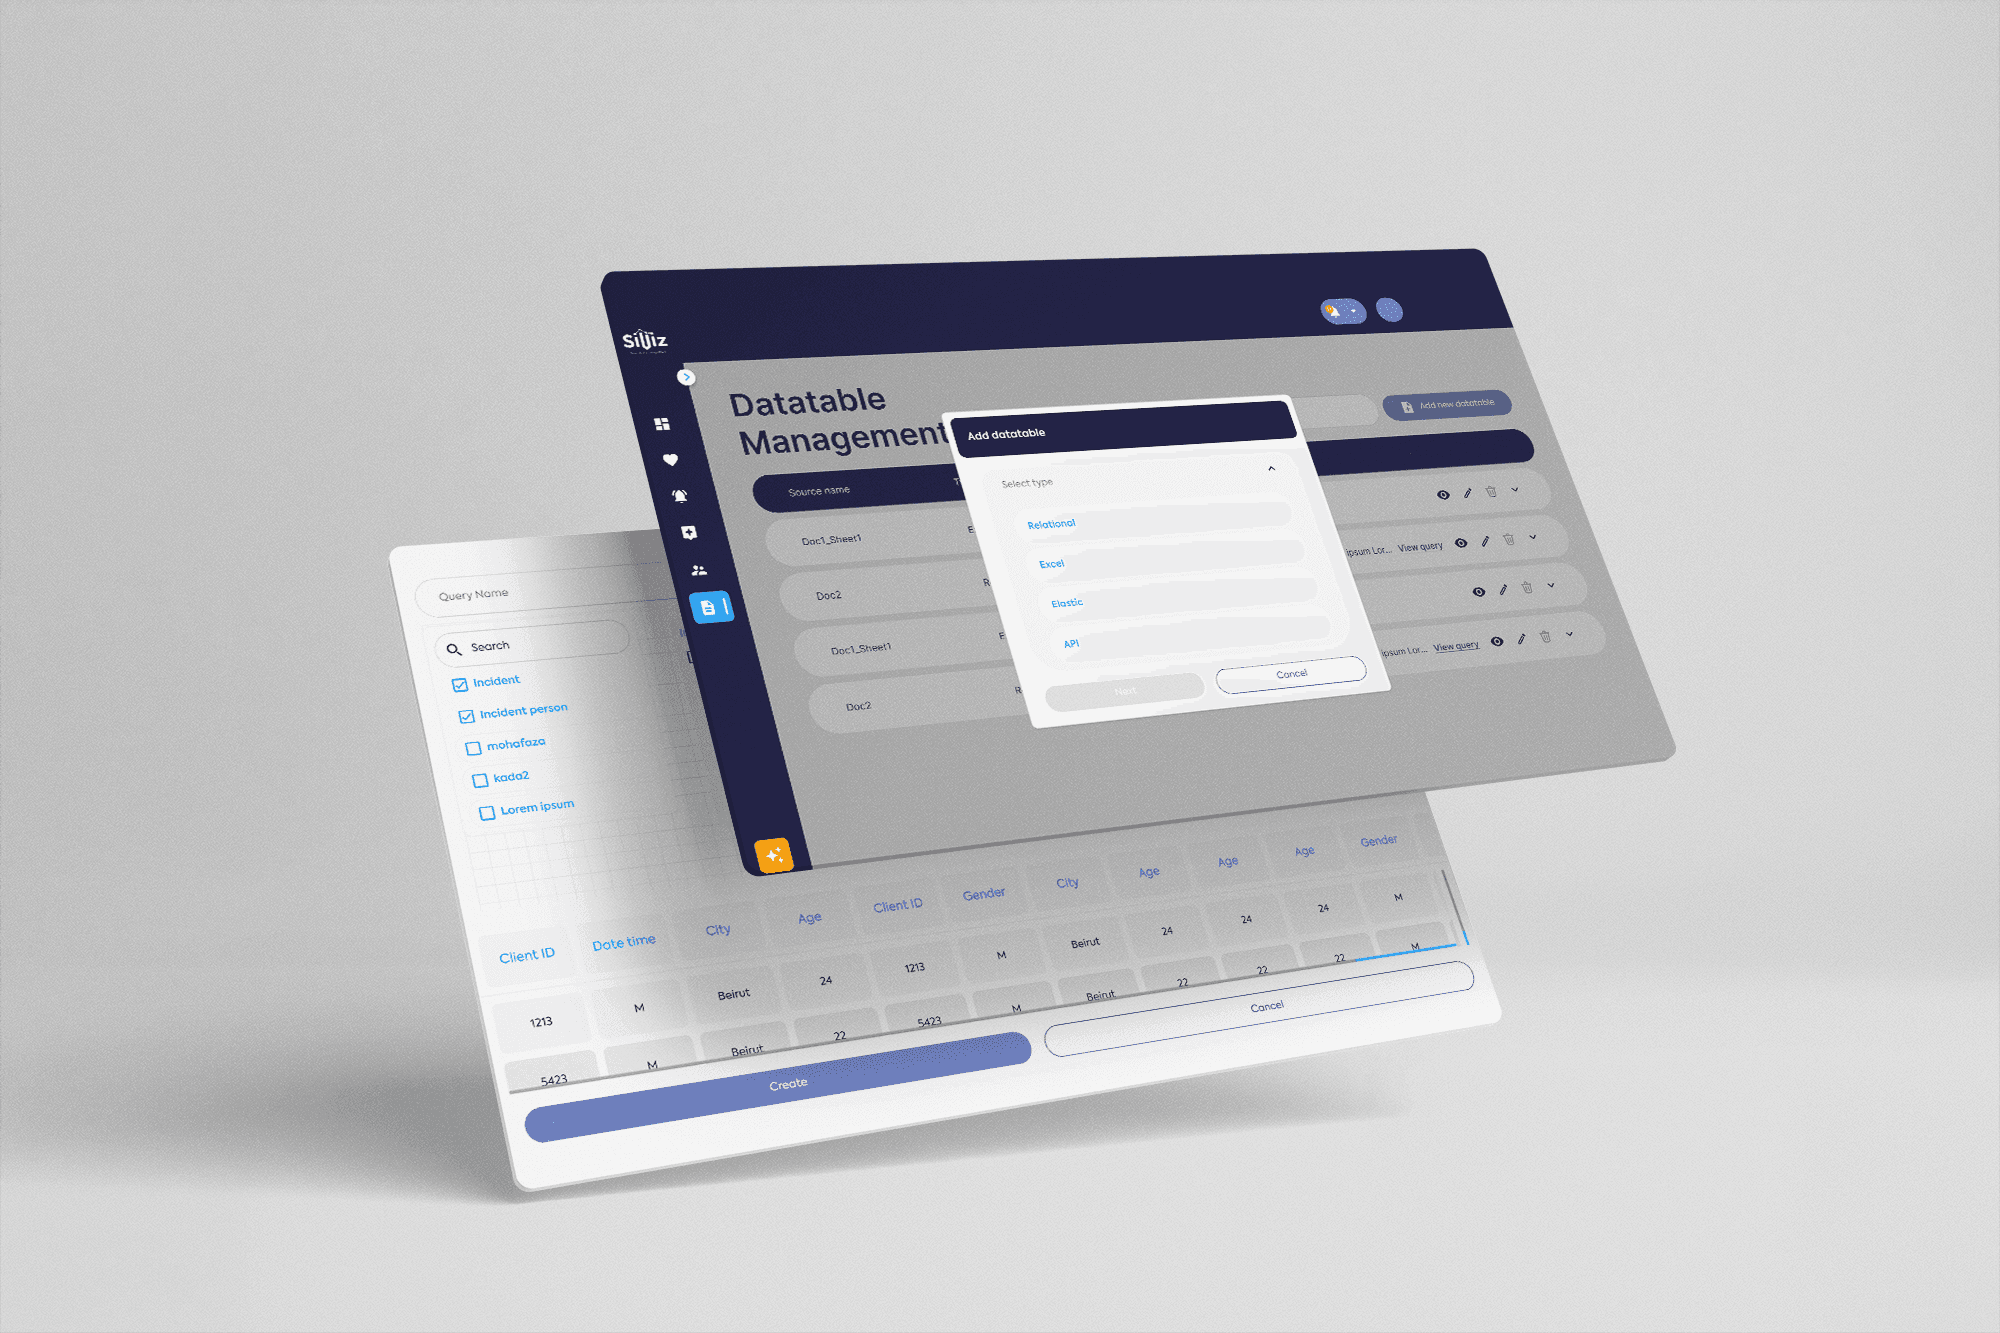
  • Seamlessly connect to multiple data sources

  • Consolidate all your data on a single platform

  • Real-time data visualization updates

SiViz is trusted by the following industries

Security Agencies

NGOs

Government

Media

Threat & Incident Pattern Analysis

Identify hotspots and analyze emerging threats using interactive heat maps and temporal trends, enabling smarter resource deployment and proactive prevention strategies.

Strategic Analysis and Planning

Embed structured data analysis into the decision-making process, supporting mission analysis, course of action development, and operational planning with evidence-based insights.

Response Optimization

Visualize emergency and tactical response times, deployment patterns, and resource utilization to support real-time decision-making and improve operational efficiency.

Case Management & Network Mapping

Connect related incidents, visualize investigative leads, and map out criminal or threat networks to streamline investigations and intelligence workflows across agencies.

Community & Intelligence Insights

Integrate public reports, open-source intelligence (OSINT), social media sentiment, and community feedback into centralized dashboards to monitor perceptions, detect unrest, and enhance situational awareness.

Security Agencies

Government

NGOs

Media

Threat & Incident Pattern Analysis

Identify hotspots and analyze emerging threats using interactive heat maps and temporal trends, enabling smarter resource deployment and proactive prevention strategies.

Strategic Analysis and Planning

Embed structured data analysis into the decision-making process, supporting mission analysis, course of action development, and operational planning with evidence-based insights.

Response Optimization

Visualize emergency and tactical response times, deployment patterns, and resource utilization to support real-time decision-making and improve operational efficiency.

Case Management & Network Mapping

Connect related incidents, visualize investigative leads, and map out criminal or threat networks to streamline investigations and intelligence workflows across agencies.

Community & Intelligence Insights

Integrate public reports, open-source intelligence (OSINT), social media sentiment, and community feedback into centralized dashboards to monitor perceptions, detect unrest, and enhance situational awareness.

Security Agencies

Government

NGOs

Media

Threat & Incident Pattern Analysis

Identify hotspots and analyze emerging threats using interactive heat maps and temporal trends, enabling smarter resource deployment and proactive prevention strategies.

Strategic Analysis and Planning

Embed structured data analysis into the decision-making process, supporting mission analysis, course of action development, and operational planning with evidence-based insights.

Response Optimization

Visualize emergency and tactical response times, deployment patterns, and resource utilization to support real-time decision-making and improve operational efficiency.

Case Management & Network Mapping

Connect related incidents, visualize investigative leads, and map out criminal or threat networks to streamline investigations and intelligence workflows across agencies.

Community & Intelligence Insights

Integrate public reports, open-source intelligence (OSINT), social media sentiment, and community feedback into centralized dashboards to monitor perceptions, detect unrest, and enhance situational awareness.

What types of data sources can SiViz connect to?

How customizable are the visualizations in SiViz?

Is my data secure with SiViz?

How often are the visualizations updated?

V1.0.0

2023-2024

SiViz has been co-developed with partners across multiple sectors, incorporating their feedback and real-world needs throughout its pilot phase. This collaborative approach ensured reaching version 2.0.0, a robust & versatile analytics platform ready for broad adoption.

V1.0.0

2023-2024

SiViz has been co-developed with partners across multiple sectors, incorporating their feedback and real-world needs throughout its pilot phase. This collaborative approach ensured reaching version 2.0.0, a robust & versatile analytics platform ready for broad adoption.

V1.0.0

2023-2024

V2.0.0

April, 2025

Augmented visualization capabilities & a redesigned chart builder, putting end-users in control. Performance boosted, enabling the handling of millions of data points. The release also features smart filters, enhanced chart appearance controls, and a refreshed, user-friendly interface.

V2.0.0

April, 2025

Augmented visualization capabilities & a redesigned chart builder, putting end-users in control. Performance boosted, enabling the handling of millions of data points. The release also features smart filters, enhanced chart appearance controls, and a refreshed, user-friendly interface.

V2.0.0

April, 2025

V2.0.5

June, 2025

Users empowered with enhanced data export options, improved chat management, and more informative dashboard exports—driving better data accessibility, collaboration, and reporting for business users.

V2.0.5

June, 2025

Users empowered with enhanced data export options, improved chat management, and more informative dashboard exports—driving better data accessibility, collaboration, and reporting for business users.

V2.0.5

June, 2025

Have a question?

Send us an email at info@siviz.io

SiViz is designed and developed by Siren Analytics.

© 2026 Siren Analytics. All Rights Reserved.

Have a question?

Send us an email at sivizaihello@gmail.com

SiViz is designed and developed by Siren Analytics.

© 2026 Siren Analytics. All Rights Reserved.

Have a question?

Send us an email at info@siviz.io

SiViz is designed and developed by Siren Analytics.

© 2026 Siren Analytics. All Rights Reserved.